plots = \
[
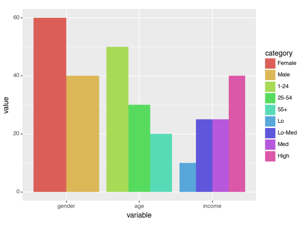
dict(nb_path= 'test_nbs/geom_col.ipynb',
label='two_variable_bar_plot'),
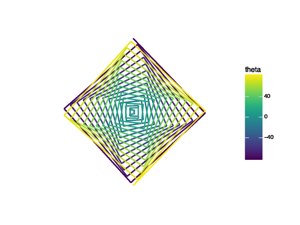
dict(nb_path='test_nbs/PlotnineAnimation.ipynb',
label='spiral'),
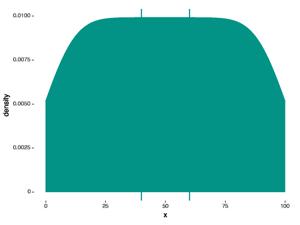
dict(nb_path='test_nbs/geom_density.ipynb',
label='density_curve'),
dict(nb_path='test_nbs/geom_map.ipynb',
label='map'),
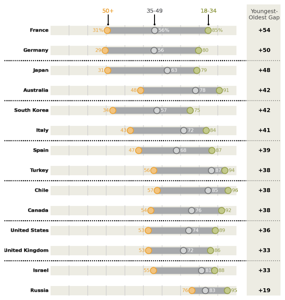
dict(nb_path='test_nbs/geom_segment.ipynb',
label='ranges'),
dict(nb_path='test_nbs/geom_segment.ipynb',
label='rank')
]gallery
Arrange thumbnails as a gallery
emb_img
 emb_img (nb_path:str, label:str, caption:str='', anchor='#example',
          size=(150, 150))
Embed a thumbnail image as a markdown cell.
| Type | Default | Details | |
|---|---|---|---|
| nb_path | str | the path to the notebook | |
| label | str | the label indicating the cell where the plot is, see https://quarto.org/docs/authoring/notebook-embed.html#code-cell-options for an example. | |
| caption | str | the caption, will be inferred from label if not specified. | |
| anchor | str | #example | anchor tag in source page, this defaults to #example for plotnine: https://plotnine.readthedocs.io |
| size | tuple | (150, 150) | size of the thumbnail |
| Returns | str |
We can embed an image with markdown like this:
md = emb_img(nb_path='test_nbs/geom_col.ipynb',
             label='two_variable_bar_plot')
print(md)Create a gallery
gallery
gallery (plots:list[dict])
Arrange plots into a gallery.
| Type | Details | |
|---|---|---|
| plots | list | a list of dictionaries which contain arguments for emb_img. |
| Returns | str |
To use gallery, you must construct a list of dicts whose keys are arguments to emb_img:
Customize your css styles
For this gallery to show up well in Quarto, we recommend including the following css in your quarto project:
/* css styles */
.plot-gallery {
  height: 175px;
  object-fit: contain;
}
Note that the class plot-gallery is inserted by gallery around each image.
print(gallery(plots))